STATEN ISLAND, N.Y. — A map developed by climate experts at the National Oceanic and Atmospheric Administration’s (NOAA) National Centers for Environmental Information (NCEI) have created a “Coldest Day of the Year” map.
The interactive map compiles data from the 1991–2020 U.S. Climate Normals, NCEI’s 30-year averages of climatological variables including the average low temperature for each day, as noted on climate.gov. In analyzing this data, scientists are able to identify which day of the year, on average, has the lowest minimum temperature and is therefore dubbed, “the coldest.”
In looking at the Central Park station data, the map reveals that Jan. 24 is typically the coldest day of the year on average; both the Brooklyn and Bronx stations support the finding in marking the day as the most frigid. The station also notes that the average low temperature for the day is 27.10 degrees.
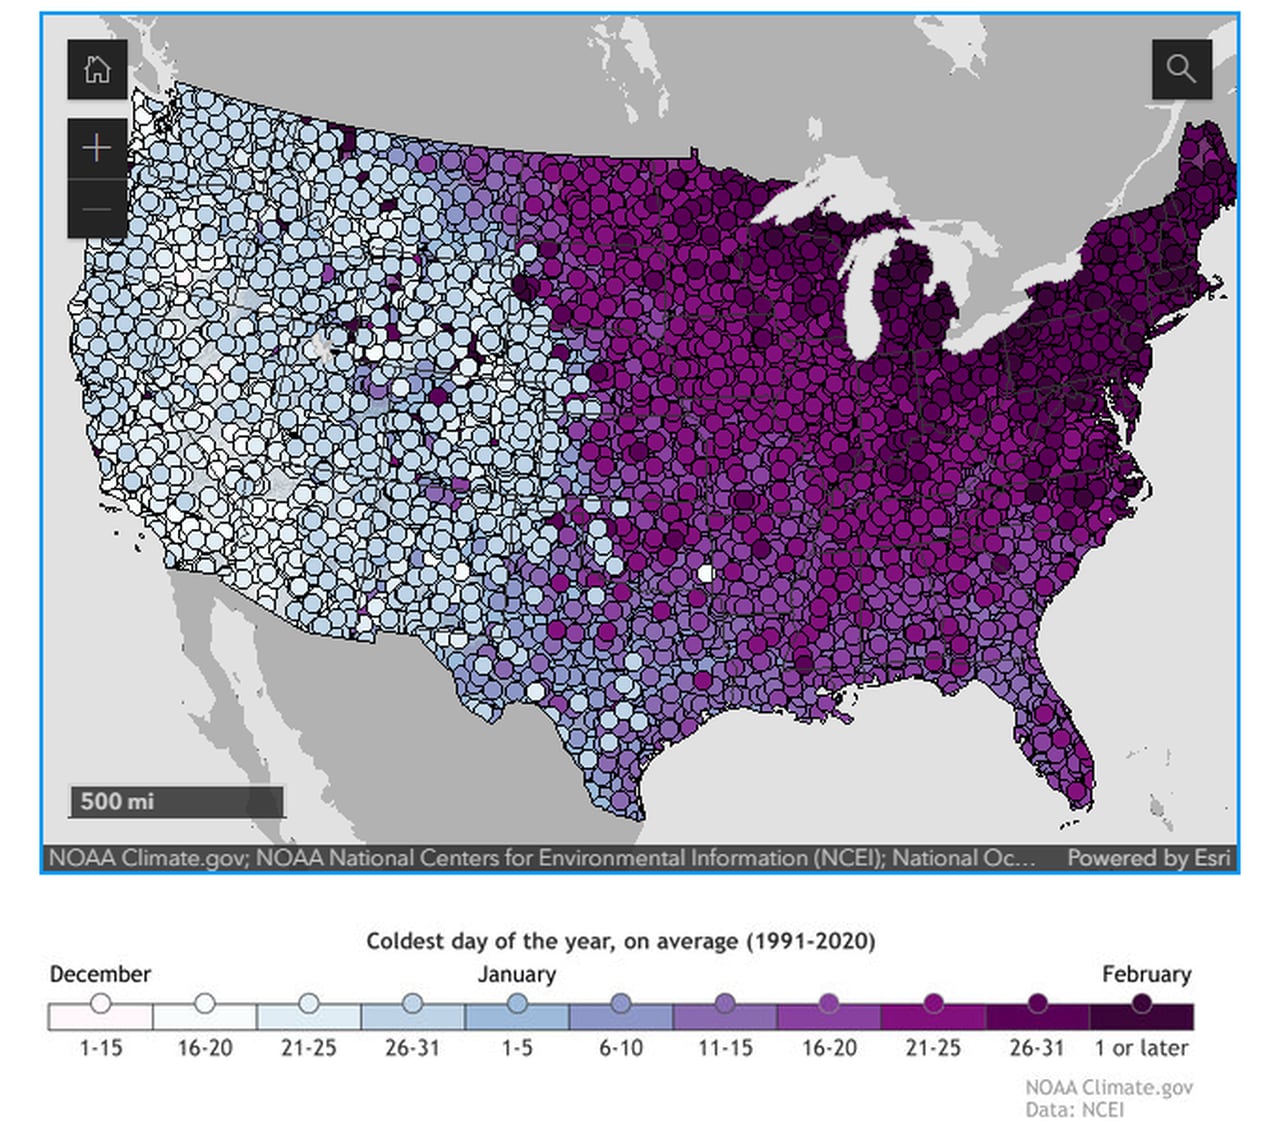
Interestingly, the states in the West typically reach their coldest day in December, whereas most states in the East reach their seasonal minimum in January, as shown in the map.
The West can credit this to the flow of moderating air masses with clouds and precipitation coming ashore from the Pacific Ocean and aligning closely to the seasonal solar cycle, as detailed on climate.gov. Meanwhile, the East grows coldest at the tail end of January thanks to cold air flowing south from Canada which is altered by snow cover reflecting solar radiation away from the Earth’s surface.
Read the full article here
Leave a Reply